Presentation
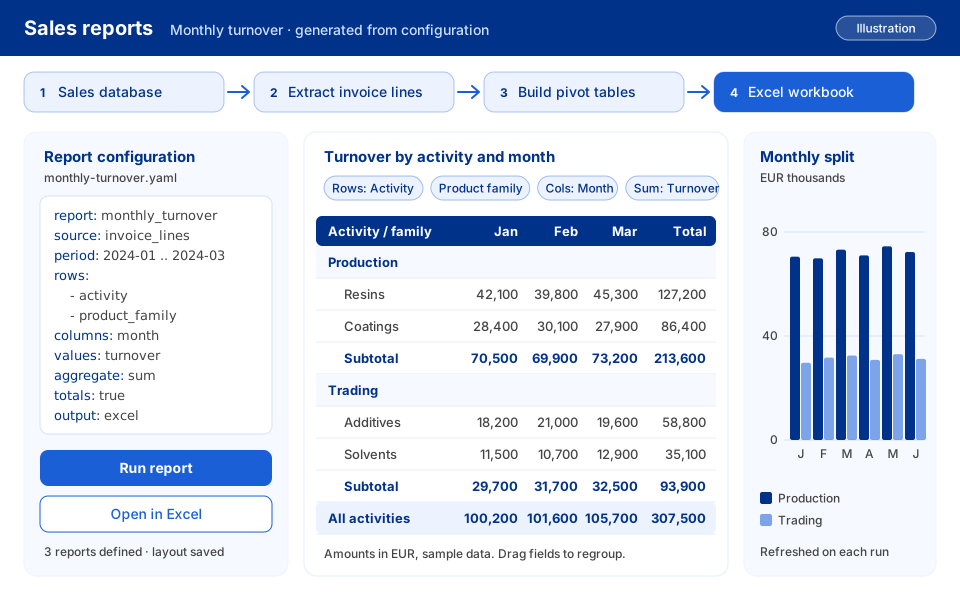
A chemicals group needed its sales figures taken out of the company database and turned into pivot tables, without rebuilding each report by hand. Gilbert and Vincent Brault built an automation that extracts the invoice lines from the database and produces the pivot tables from a configuration describing each report: which rows, columns and totals to show. The same data can be explored in an interactive pivot table, where users drag fields to regroup the figures, and a layout they settle on is kept for reuse. Reports such as monthly turnover split between production and trading, then by product family, are regenerated from fresh data and delivered as Excel spreadsheets.
On the Platform This software Its client Its service